Modern digital systems are built on layers of interconnected infrastructure that span private data centers, public cloud platforms, third-party services, and global internet pathways. Within this environment, maintaining consistent application performance is no longer a simple task of monitoring internal servers. Instead, it requires continuous visibility into how data moves across complex and often unpredictable networks. This is where network and digital performance monitoring tools become essential for organizations that depend on uninterrupted digital services.
At a fundamental level, these monitoring systems exist to answer a deceptively simple question: what happens to user requests once they leave a device and begin traveling across the internet? The answer is rarely straightforward. A single request may pass through multiple autonomous systems, traverse different continents, interact with various DNS providers, and rely on multiple cloud services before reaching its destination. Each of these transitions introduces potential points of delay, failure, or degradation.
As digital transformation accelerates, organizations are increasingly dependent on distributed systems rather than localized infrastructure. Applications are no longer hosted in a single environment but are instead spread across multiple cloud providers, edge locations, and content delivery networks. This distribution improves scalability and resilience but also introduces complexity that traditional monitoring tools struggle to interpret.
In response to this complexity, modern observability platforms focus not just on whether systems are “up” or “down,” but on how efficiently and reliably they deliver services across the entire digital journey. This includes tracking latency variations, identifying routing inefficiencies, detecting packet loss, and understanding how external dependencies affect performance.
Network and digital performance monitoring tools are particularly important in environments where user expectations are high and tolerance for delays is low. Even minor disruptions, such as a slow-loading page or intermittent connectivity issues, can impact user engagement, customer satisfaction, and ultimately business outcomes. As a result, organizations have shifted their focus from reactive troubleshooting to proactive performance analysis.
Within this evolving landscape, platforms designed for deep network insight and user experience visibility have gained prominence. These tools are built to observe digital systems from multiple vantage points, including infrastructure layers, application layers, and end-user perspectives. Their purpose is not only to detect problems but to help understand their origin and potential impact across the entire system.
Why Enterprises Rely on Visibility Tools in Distributed Systems
Enterprises today operate in environments where traditional boundaries between networks have largely dissolved. Applications are deployed across hybrid infrastructures that combine on-premises servers with multiple cloud platforms. Employees access systems from different geographic regions, often through diverse internet service providers. Customers interact with digital services from a wide range of devices and network conditions. This diversity creates a performance landscape that is highly variable and difficult to predict.
Visibility tools have become essential because they provide clarity in environments where direct control is limited. Unlike internal systems that can be fully managed by IT teams, internet-based pathways involve external networks that are not owned or controlled by a single organization. This means that performance issues may originate far outside an organization’s immediate infrastructure.
For example, a slowdown in application response time might not be caused by the application itself but by congestion in a transit network or a failure in a third-party DNS resolver. Without visibility into these external components, diagnosing such issues becomes time-consuming and often speculative.
Visibility tools address this challenge by continuously monitoring the path between users and services. They provide insights into how data flows through different regions of the internet and highlight where disruptions occur. This level of insight allows teams to distinguish between internal performance issues and external network conditions.
Another important reason enterprises rely on these tools is the need for consistency in user experience. In a global digital economy, users expect the same level of performance regardless of their location. However, achieving this consistency is difficult due to variations in network infrastructure across regions. Some areas may have high-speed connectivity and low latency, while others may experience congestion or limited bandwidth.
Visibility tools help identify these disparities by analyzing performance from multiple geographic points. This allows organizations to understand how their services behave under different network conditions and adjust their infrastructure or delivery strategies accordingly.
Additionally, as applications become more dependent on third-party services such as cloud APIs, authentication providers, and content delivery networks, visibility into external dependencies becomes crucial. A failure in one external service can cascade across multiple applications, affecting performance in unexpected ways. Monitoring tools help isolate these dependencies and provide a clearer understanding of how they influence overall system behavior.
Core Philosophy Behind ThousandEyes and Its Observability Approach
Among modern network visibility platforms, ThousandEyes is built around a philosophy centered on understanding the internet as an extension of the enterprise network. Rather than treating external networks as opaque or uncontrollable environments, it approaches them as observable systems that can be analyzed, measured, and interpreted.
This perspective shifts the focus from internal infrastructure monitoring to end-to-end visibility. Instead of only examining servers, routers, or applications within a controlled environment, the system extends observation outward to include the entire path between users and services.
The core idea is that performance issues often emerge not within isolated systems but at the intersections between networks. These intersections include ISP transitions, cloud gateways, DNS resolution paths, and peering points between major network providers. By focusing on these areas, ThousandEyes aims to provide a more complete understanding of how digital experiences are shaped.
Another important aspect of its philosophy is the emphasis on internet-level intelligence. Traditional monitoring systems are often limited to infrastructure within a defined boundary. However, modern applications depend heavily on services that exist beyond those boundaries. ThousandEyes extends visibility into these external environments, enabling organizations to see how the broader internet behaves in relation to their services.
This approach also introduces the concept of distributed vantage points. Instead of relying on a single monitoring location, data is collected from multiple global points of presence. These vantage points simulate real-world user conditions and provide a more accurate representation of how services perform across different regions.
By combining data from these distributed sources, the platform constructs a comprehensive view of network behavior. This includes not only direct performance metrics such as latency and packet loss but also contextual insights such as route changes, infrastructure dependencies, and service-level disruptions.
The philosophy also emphasizes continuous observation rather than periodic measurement. In dynamic network environments, conditions can change rapidly. A route that is optimal one moment may become congested or rerouted the next. Continuous monitoring ensures that these changes are detected in real time, allowing for faster response and mitigation.
Deep Dive into ThousandEyes Network Intelligence Capabilities
Network intelligence within ThousandEyes is built around the ability to observe and interpret how data travels across the internet. This involves collecting granular information about each segment of a network path and analyzing how those segments contribute to overall performance.
One of the key capabilities in this area is path visualization. This feature allows users to see the exact route that data packets take from source to destination. Instead of viewing the network as a single connection, it is broken down into individual hops, each representing a point of transition between routers or networks. This makes it easier to identify where delays or failures occur.
Path visualization also helps uncover unexpected routing behavior. In complex networks, data does not always follow the most direct route. Instead, it may be rerouted through alternative paths due to congestion, outages, or policy-based routing decisions. These changes can significantly impact performance, and without visibility into the path, they are difficult to detect.
Another important aspect of network intelligence is real-time anomaly detection. By continuously analyzing network metrics, the system can identify deviations from expected behavior. These anomalies may include sudden increases in latency, unexpected packet loss, or changes in routing paths. Detecting these issues early allows organizations to investigate and address them before they escalate into larger problems.
Network intelligence also extends to understanding the behavior of Internet service providers and backbone networks. Since much of global internet traffic depends on a limited number of major providers, disruptions in these networks can have widespread effects. By monitoring performance across multiple providers, ThousandEyes helps identify whether issues are localized or part of a broader internet disruption.
In addition, network intelligence includes the ability to correlate data across multiple layers of the digital stack. For example, a performance issue observed at the application level may be linked to a routing problem in the underlying network. By correlating these layers, the system provides a more holistic understanding of performance issues.
Internet Path Analysis and Visibility into Global Routing Behavior
Internet path analysis is one of the most critical components of modern network visibility because it reveals how data moves across a highly decentralized global infrastructure. Unlike private networks, the internet does not follow a fixed structure. Instead, it operates as a collection of interconnected systems that dynamically determine routing paths based on availability, policy, and performance.
Within this environment, even small changes in routing can have significant consequences. A slight increase in hop count can introduce additional latency, while a rerouted path through a congested region can degrade user experience. Internet path analysis helps uncover these variations by mapping each step of the journey between source and destination.
This level of visibility is particularly important for organizations that serve global audiences. Users in different regions may experience vastly different performance levels depending on how their traffic is routed. Without visibility into these paths, it becomes difficult to explain inconsistencies in user experience.
Path analysis also helps identify points of failure that may not be immediately obvious. For example, a service may appear operational, but a specific segment of the route may be experiencing intermittent packet loss. This can result in degraded performance that is difficult to diagnose without detailed path information.
Another important aspect of path visibility is the ability to observe route stability over time. In stable networks, routes remain consistent and predictable. However, in the broader internet environment, routes can change frequently due to traffic optimization, outages, or policy adjustments. Tracking these changes helps organizations understand whether performance issues are temporary or part of a larger pattern.
Cloud and SaaS Performance Tracking Across Distributed Environments
As organizations increasingly rely on cloud-based infrastructure and software-as-a-service platforms, monitoring performance across these environments has become a critical requirement. Unlike traditional applications hosted within a controlled data center, cloud-based services depend on external infrastructure that may span multiple providers and regions.
Cloud performance tracking focuses on understanding how these distributed components interact with each other and with end users. This includes measuring response times, analyzing service availability, and identifying bottlenecks that may occur within or between cloud regions.
One of the challenges in cloud environments is the lack of transparency between service layers. While cloud providers offer a certain level of performance data, it often does not provide complete visibility into the end-to-end user experience. This is where external monitoring systems play an important role by filling in the gaps between infrastructure metrics and real-world performance.
SaaS applications introduce additional complexity because they often depend on multiple underlying services. A single user request may involve authentication services, data storage systems, content delivery networks, and third-party APIs. Any delay or failure in one of these components can impact the overall experience.
Monitoring cloud and SaaS performance requires continuous observation from multiple perspectives. This includes synthetic monitoring, which simulates user interactions, as well as network-level analysis that examines how data moves between services. Together, these perspectives provide a more complete understanding of system behavior.
ThousandEyes Data Interpretation and Observability Model
The value of network monitoring does not lie solely in data collection but in the ability to interpret that data meaningfully. ThousandEyes approaches this challenge by organizing information into contextual layers that represent different aspects of network behavior.
At the foundational level, raw metrics such as latency, jitter, and packet loss are collected. These metrics provide a basic understanding of network performance but do not explain the underlying causes of issues. To address this, the system organizes data into higher-level constructs such as network paths, service dependencies, and geographic performance clusters.
This layered approach allows users to move from raw data to actionable insights. Instead of simply observing that performance has degraded, they can trace the issue back through specific network segments or external dependencies.
Observability in this context also involves correlating data across time. Network conditions are not static, and understanding trends over time is essential for identifying recurring issues. By analyzing historical patterns, it becomes possible to distinguish between temporary fluctuations and persistent problems.
Another important aspect of data interpretation is contextual awareness. Network metrics alone do not provide sufficient insight unless they are interpreted within the context of user behavior, application design, and infrastructure configuration. ThousandEyes incorporates this context into its analysis to provide a more complete picture of system performance.
Catchpoint Approach to Digital Experience Monitoring
Catchpoint is built around a different perspective on performance monitoring, one that places the end-user experience at the center of analysis. Instead of focusing primarily on network infrastructure or routing behavior, its approach is grounded in understanding how real users interact with digital systems under real-world conditions. This shift in perspective changes what is measured, how it is interpreted, and how organizations respond to performance issues.
At its core, Catchpoint treats digital performance as something that must be observed from outside the system rather than inside it. While infrastructure monitoring tells you how servers, networks, and services are behaving, it does not always explain how those behaviors translate into user experience. Catchpoint aims to bridge that gap by simulating user interactions and capturing real user behavior across diverse environments.
This approach is especially important in modern applications where performance is not defined solely by backend efficiency. A website or application may be technically operational but still deliver a poor experience due to delays in rendering, slow API responses, or inconsistent behavior across regions. Catchpoint focuses on capturing these nuances by continuously measuring how users actually experience digital services.
One of the key principles behind this approach is that performance is subject to context. A system that performs well in one region may perform poorly in another due to differences in network conditions, device capabilities, or routing efficiency. Catchpoint accounts for these variations by collecting data from multiple global points, ensuring that performance insights reflect real-world diversity.
This user-centric philosophy also emphasizes continuous testing rather than periodic checks. Digital environments change rapidly, and performance issues can emerge at any time due to external dependencies, traffic spikes, or configuration changes. Continuous monitoring ensures that these issues are detected as soon as they affect users, rather than after they have already caused disruption.
Synthetic Monitoring as a Controlled Simulation of User Behavior
Synthetic monitoring is one of the most important components of Catchpoint’s platform. It works by simulating user interactions with applications in a controlled and repeatable manner. These simulations mimic actions such as loading a webpage, logging into an application, submitting a form, or navigating through different pages.
The primary advantage of synthetic monitoring is consistency. Because the same tests are run repeatedly from multiple locations, it becomes possible to compare performance over time and across regions. This consistency helps identify performance degradation that might otherwise go unnoticed in real-world traffic.
Synthetic tests are designed to replicate typical user journeys. Instead of focusing on isolated metrics, they evaluate complete workflows. This includes measuring how long it takes for a page to load fully, how quickly APIs respond, and whether all components of a page render correctly.
By simulating user behavior, synthetic monitoring can detect issues before they affect actual users. For example, if a login page begins to slow down due to a backend service issue, synthetic tests will capture this degradation even if real users have not yet been significantly impacted.
Another important aspect of synthetic monitoring is its ability to test from multiple geographic locations. This helps identify regional performance differences that might otherwise be hidden. A service might perform well in one region but poorly in another due to routing inefficiencies or localized network congestion.
Synthetic monitoring also supports testing under different network conditions. This includes simulating slow connections, high latency environments, or mobile network conditions. By doing so, it provides insight into how applications behave under less-than-ideal circumstances.
Real User Monitoring and Behavioral Data Interpretation
Real User Monitoring (RUM) is another foundational capability within Catchpoint’s platform. Unlike synthetic monitoring, which simulates user behavior, RUM collects data from actual user interactions. This provides an authentic view of how real users experience digital services.
RUM captures a wide range of performance metrics directly from user sessions. This includes page load times, interaction delays, error rates, and session durations. Because this data comes from real users, it reflects actual conditions rather than controlled simulations.
One of the most valuable aspects of RUM is its ability to reveal performance variations across different user segments. Users may access applications from different devices, browsers, or network conditions, all of which can influence performance. RUM data helps identify patterns within these segments and highlights areas where optimization may be needed.
Another important feature of RUM is its ability to connect performance data with user behavior. For example, if users are abandoning a page at a high rate, RUM can help determine whether performance issues are contributing to that behavior. This connection between performance and engagement is critical for understanding the broader impact of technical issues.
RUM also provides insight into long-term performance trends. By analyzing historical user data, organizations can identify whether performance is improving or degrading over time. This helps guide optimization efforts and prioritize areas that require attention.
Unlike synthetic monitoring, which is proactive, RUM is inherently reactive. It captures issues as they occur in real time, providing immediate insight into how users are being affected. When combined with synthetic monitoring, it creates a more complete picture of performance by covering both predicted and actual behavior.
Endpoint Monitoring and Last-Mile Performance Visibility
Endpoint monitoring focuses on the final segment of the digital delivery chain: the connection between the user’s device and the application. This segment, often referred to as the “last mile,” is one of the most variable and difficult to control parts of the network.
Performance issues in the last mile can arise from a variety of factors, including local network congestion, Wi-Fi instability, device limitations, or ISP routing inefficiencies. Because this segment is outside the direct control of application providers, it often becomes a blind spot in traditional monitoring systems.
Catchpoint addresses this challenge by collecting performance data directly from end-user devices or simulated endpoints. This provides visibility into how applications perform under real-world conditions at the edge of the network.
Endpoint monitoring measures a range of factors, including connection stability, latency to the nearest service node, and responsiveness of application components. It also evaluates how performance changes based on different access methods, such as mobile networks versus broadband connections.
One of the key benefits of endpoint monitoring is its ability to isolate last-mile issues from backend problems. When performance degradation occurs, it can be difficult to determine whether the cause lies within the application infrastructure or the user’s local environment. Endpoint data helps clarify this distinction by providing insight into the final segment of the delivery path.
This type of monitoring is especially important for global applications that serve users across diverse network environments. In regions with inconsistent connectivity, last-mile performance can vary significantly, making it a critical factor in overall user experience.
Internet Performance Visibility from Multiple Global Vantage Points
Catchpoint’s global monitoring network plays a central role in its ability to observe internet performance at scale. Deploying monitoring agents across multiple geographic regions, it creates a distributed observation system that reflects real-world internet behavior.
Each vantage point acts as an independent observation node, capable of running tests, collecting data, and reporting performance metrics. Together, these nodes form a global network that continuously measures how digital services perform from different locations.
This distributed approach is essential because internet performance is inherently regional. A service may perform differently in North America, Europe, Asia, or Africa due to variations in infrastructure, routing paths, and network congestion. By collecting data from multiple regions, Catchpoint provides a more accurate representation of global performance.
Global vantage points also help identify localized outages or disruptions. If a service is experiencing issues in one region but not others, it suggests a localized problem rather than a global failure. This distinction is critical for prioritizing incident response and troubleshooting efforts.
Another important benefit of global visibility is the ability to compare performance across regions. This helps organizations understand where their services perform best and where improvements are needed. It also supports decisions related to content delivery optimization and infrastructure placement.
Application Performance Insights from a User Journey Perspective
Catchpoint places significant emphasis on analyzing application performance through the lens of complete user journeys. Instead of focusing on isolated components such as servers or APIs, it evaluates how all components work together to deliver a seamless experience.
A user journey typically consists of multiple steps, such as loading a homepage, navigating through content, performing searches, and completing transactions. Each of these steps depends on multiple underlying systems working in coordination.
By analyzing these journeys, Catchpoint provides insight into where delays or failures occur within the flow of interaction. This helps identify not only technical issues but also design inefficiencies that may impact usability.
For example, a delay in loading a product page might be caused by slow API responses, inefficient database queries, or network congestion. User journey analysis helps pinpoint which part of the sequence is responsible for the delay.
This approach also helps organizations understand how performance impacts user behavior. If users consistently abandon a journey at a specific step, it may indicate a performance bottleneck or usability issue. By identifying these points of friction, organizations can make targeted improvements.
Performance Correlation Between Infrastructure and User Experience
One of the strengths of Catchpoint’s monitoring approach is its ability to correlate infrastructure performance with user experience. While infrastructure metrics provide insight into system health, they do not always reflect how users perceive performance.
Correlation analysis bridges this gap by connecting backend performance data with frontend user behavior. For example, an increase in server response time might be correlated with a rise in page abandonment rates. This relationship helps demonstrate the real-world impact of technical issues.
Correlation also helps prioritize issues based on their user impact. Not all performance issues affect users equally. Some may have minimal visible impact, while others may significantly degrade the experience. By linking infrastructure metrics with user data, organizations can focus on the most impactful problems.
This type of analysis also supports root cause identification. When multiple metrics degrade simultaneously, correlation helps determine whether they are related or independent issues. This reduces diagnostic complexity and accelerates resolution.
Observability Through Behavioral and Environmental Context
Catchpoint extends traditional monitoring by incorporating behavioral and environmental context into its observability model. This means that performance data is not interpreted in isolation but is analyzed in relation to user behavior, device conditions, and environmental factors.
Behavioral context includes understanding how users interact with applications. For example, repeated actions, navigation patterns, and session durations can all influence performance interpretation.
Environmental context includes factors such as device type, operating system, browser version, and network conditions. These variables can significantly affect performance and must be considered when analyzing data.
By integrating these contexts, Catchpoint provides a more nuanced understanding of performance. Instead of simply reporting that a page is slow, it can explain why it is slow under specific conditions and for specific user groups.
This contextual awareness is essential for modern digital environments where user diversity is high. Applications must perform consistently across a wide range of conditions, and understanding these variations is key to achieving that goal.
ThousandEyes vs Catchpoint in Real-World Operational Scenarios
When organizations evaluate network and digital performance monitoring platforms, theoretical features matter less than how those tools behave under real operational pressure. Modern digital environments are not stable systems; they are constantly shifting ecosystems where traffic patterns change by the hour, dependencies evolve without notice, and user expectations remain consistently high. In such conditions, the practical differences between ThousandEyes and Catchpoint become more visible.
In enterprise network operations, ThousandEyes is often used when the primary concern is understanding how data moves through the internet and where disruptions originate along that path. Large organizations with globally distributed infrastructure rely on it to trace connectivity issues that may arise between cloud providers, internet service providers, and internal systems. The platform becomes especially useful when incidents are complex and span multiple external networks, where internal logs alone cannot explain the problem.
Catchpoint, on the other hand, is frequently applied in scenarios where user-facing performance is the central concern. Organizations that prioritize customer interaction quality tend to focus on how quickly pages load, how reliably transactions complete, and how consistently services behave under varying user conditions. In these environments, identifying whether users are experiencing friction becomes more important than understanding every intermediate network hop.
In real-world operations, these differences translate into distinct workflows. A network operations team using ThousandEyes might focus on diagnosing routing instability between cloud regions or identifying where packet loss is introduced across ISP boundaries. Meanwhile, a digital experience team using Catchpoint might focus on identifying which user journeys are failing, which regions are experiencing slow load times, or how application responsiveness varies across devices.
Although both platforms aim to improve performance visibility, they approach the problem from different angles. One emphasizes infrastructure pathways, while the other emphasizes user perception. In practice, many large organizations use insights from both perspectives to build a more complete understanding of system health.
Incident Detection and Root Cause Analysis Differences
Incident detection is one of the most critical functions of any monitoring system, and it is also where the philosophical differences between ThousandEyes and Catchpoint become particularly clear. In complex digital environments, incidents rarely originate from a single source. Instead, they emerge from interactions between multiple systems, networks, and dependencies.
ThousandEyes detects incidents primarily by observing deviations in network behavior. When latency increases, routes change unexpectedly, or packet loss appears in specific segments, the system flags these anomalies and traces them through the network path. This allows teams to identify where in the internet stack the issue is occurring.
Root cause analysis in this context is heavily focused on infrastructure behavior. For example, a slowdown in application performance might be traced back to congestion in a transit provider or instability in a peering connection between networks. This level of visibility is especially valuable when issues are external to the organization’s own systems.
Catchpoint approaches incident detection from the opposite direction. Instead of starting with infrastructure anomalies, it begins with user experience degradation. When synthetic tests or real user sessions show increased load times or failures, the system investigates where in the user journey the issue is occurring.
Root cause analysis in Catchpoint often focuses on application layers, third-party services, or last-mile connectivity. For example, a failed checkout process might be linked to a slow API response, a misconfigured content delivery node, or regional network congestion affecting end users.
The difference in approach means that ThousandEyes is often more effective at answering “where did the network fail,” while Catchpoint is more effective at answering “how did the user experience break.” Both perspectives are valuable, but they serve different diagnostic needs.
Observability Depth Versus Experience Breadth
A useful way to understand the distinction between these platforms is to compare the depth versus the breadth of observability. ThousandEyes tends to provide deep visibility into network structures. It examines individual hops, routing decisions, and infrastructure relationships in detail. This depth is particularly useful for engineers who need to understand precise network behavior at a granular level.
Catchpoint, by contrast, provides broader visibility into how systems perform from a user perspective. Instead of focusing on individual network segments, it evaluates complete user journeys across multiple environments. This breadth helps organizations understand how performance varies across regions, devices, and conditions.
In practice, this means that ThousandEyes may reveal exactly where in a network path latency is introduced, while Catchpoint may reveal that users in a specific region are abandoning a process due to slow response times. One provides technical precision, while the other provides experiential context.
Neither approach is inherently superior; they simply serve different analytical purposes. Depth is critical when diagnosing complex infrastructure issues, while breadth is essential when understanding user behavior at scale.
Handling Cloud Dependencies and Third-Party Services
Modern applications rarely operate in isolation. They depend heavily on cloud infrastructure, external APIs, authentication systems, and content delivery networks. These dependencies introduce additional layers of complexity that can affect performance in unpredictable ways.
ThousandEyes addresses this complexity by mapping how traffic flows between these services. It can identify whether delays are occurring within cloud provider networks, between regions, or at peering points with external systems. This makes it particularly useful for understanding infrastructure-level dependencies.
For example, if an application hosted in a cloud environment experiences slow response times, ThousandEyes can help determine whether the issue originates within the cloud region itself or in the network path leading to it. This distinction is critical for cloud-based troubleshooting.
Catchpoint approaches dependencies from a user experience perspective. Instead of focusing on how services are connected, it focuses on how delays in those services affect the end-user journey. If a third-party authentication service slows down, Catchpoint will detect increased login times and user drop-offs.
This difference in perspective is important in environments where multiple external dependencies interact. While ThousandEyes can identify where a dependency is failing in the network, Catchpoint can show how that failure impacts user behavior and engagement.
Performance Optimization Strategies Driven by Each Platform
The insights generated by ThousandEyes and Catchpoint naturally lead to different optimization strategies. ThousandEyes-driven optimization tends to focus on improving network efficiency. This may involve adjusting routing policies, working with internet service providers to resolve congestion, or optimizing cloud network configurations.
Because it provides detailed visibility into network paths, it allows engineers to make precise adjustments to infrastructure. These adjustments often aim to reduce latency, improve packet delivery, or stabilize routing behavior.
Catchpoint-driven optimization focuses on improving user experience outcomes. This may involve optimizing page load sequences, improving frontend performance, reducing dependency delays, or enhancing content delivery strategies. The goal is not just to improve technical metrics but to improve how users perceive performance.
For example, if Catchpoint identifies that users in a specific region experience slow page loads, the optimization strategy might involve deploying additional edge resources or improving content caching in that region. The emphasis is on reducing friction in the user journey.
In many organizations, these two approaches complement each other. Network-level optimizations improve the underlying infrastructure, while experience-level optimizations ensure that improvements are reflected in user behavior.
Scalability Challenges in Global Monitoring Systems
As digital systems scale globally, monitoring becomes significantly more complex. The number of variables increases, including geographic diversity, network variability, and dependency complexity. Both ThousandEyes and Catchpoint address scalability, but in different ways.
ThousandEyes scales by distributing monitoring agents across multiple global locations and collecting detailed network path data from each point. This allows it to maintain visibility into large-scale network behavior without relying on a single observation point.
Catchpoint scales by expanding its global testing infrastructure and increasing the number of synthetic and real user data collection points. This ensures that user experience data reflects a wide range of conditions and environments.
However, scalability introduces challenges in data interpretation. As the volume of monitoring data increases, distinguishing between meaningful signals and normal variability becomes more difficult. Both platforms rely on advanced analytics to filter noise and highlight significant performance changes.
In large-scale environments, the ability to prioritize issues becomes just as important as detecting them. Not every performance fluctuation requires immediate action. Understanding which issues affect critical user paths or core network infrastructure is essential for effective operations.
Choosing Between Network-Centric and Experience-Centric Monitoring
The choice between ThousandEyes and Catchpoint ultimately depends on how an organization defines performance priorities. Organizations that operate complex network infrastructures, manage global cloud deployments, or require deep visibility into internet routing behavior tend to benefit more from network-centric monitoring approaches.
These environments often require detailed diagnostic capabilities that can trace issues across multiple layers of infrastructure. In such cases, understanding the exact location and cause of network disruptions is critical for maintaining stability.
Organizations that prioritize customer-facing applications, digital services, or user engagement metrics often benefit more from experience-centric monitoring approaches. In these environments, the primary concern is not just whether systems are functioning, but whether users are able to interact with them efficiently and without friction.
Experience-centric monitoring provides insight into how users perceive performance, which is often more directly tied to business outcomes than infrastructure metrics alone.
In many modern enterprises, the distinction between these two approaches is becoming less rigid. As systems grow more complex, organizations increasingly require both infrastructure visibility and user experience insight to fully understand performance behavior.
The real value emerges when both perspectives are used together. Network-level intelligence explains how systems behave internally, while experience-level intelligence explains how those behaviors are perceived externally.
Conclusion
The comparison between ThousandEyes and Catchpoint ultimately reflects a broader shift in how modern organizations understand and manage digital performance. As systems move away from centralized infrastructure and toward distributed, cloud-heavy architectures, the definition of “good performance” is no longer limited to server uptime or network stability. Instead, it now includes how reliably and smoothly users can interact with services across unpredictable global conditions.
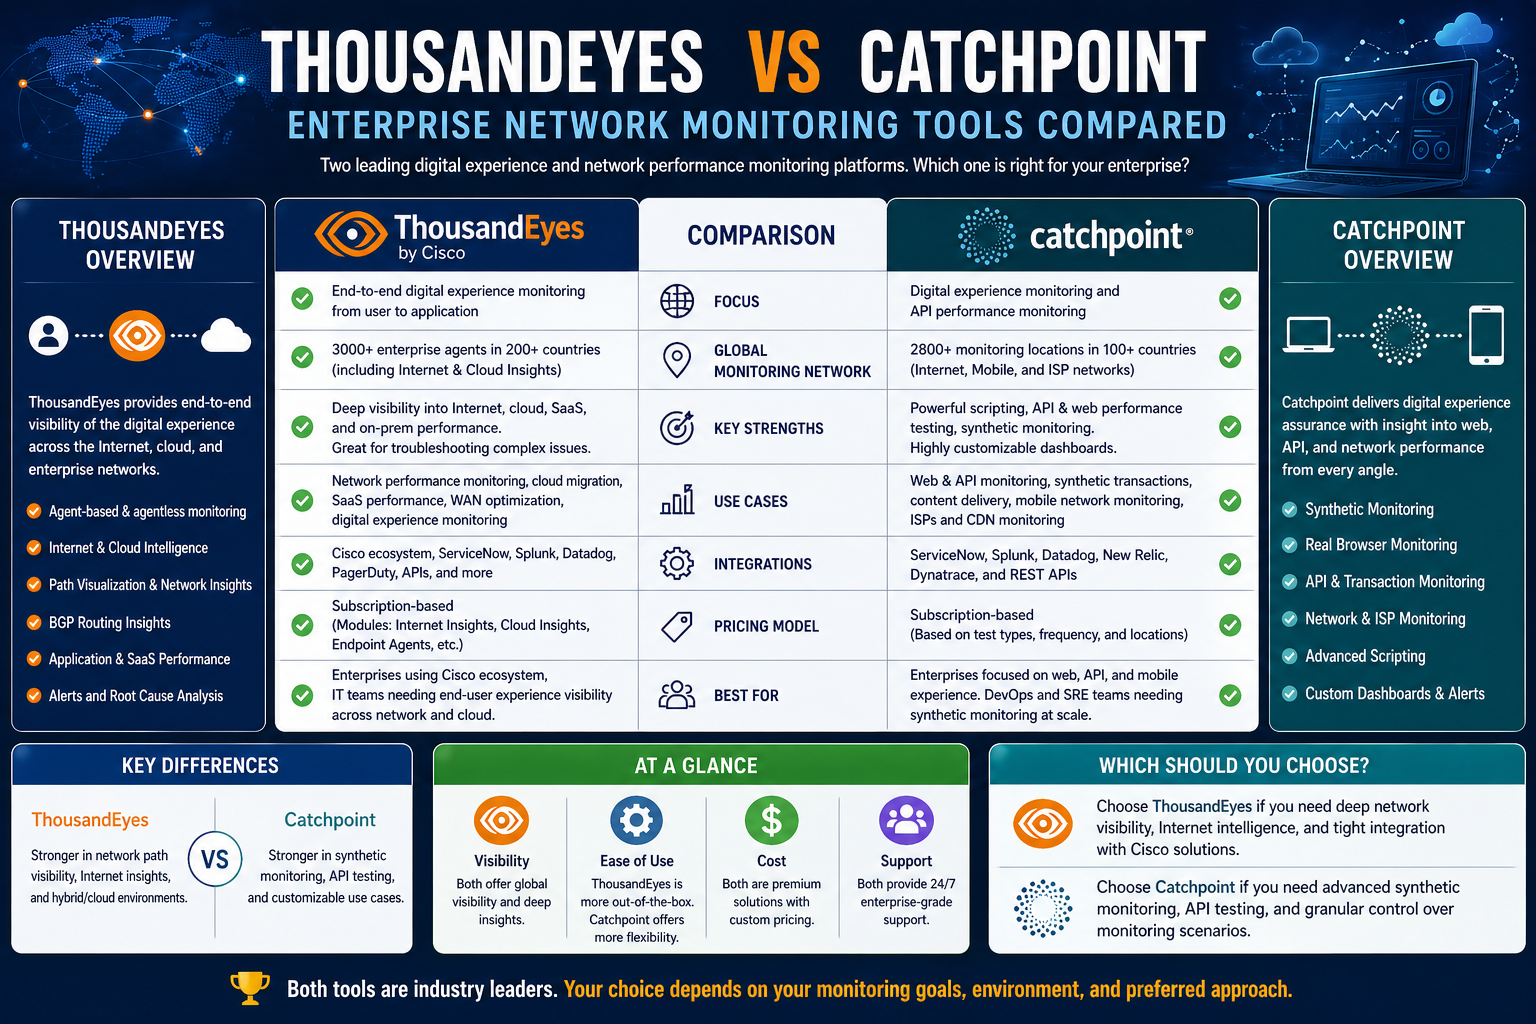
ThousandEyes represents a network-centric approach to this challenge. Its strength lies in exposing the invisible pathways that connect users to applications across the internet. By mapping traffic routes, analyzing network hops, and identifying disruptions across internet service providers and cloud environments, it provides deep technical visibility into how digital communication actually travels. This level of insight is particularly valuable for diagnosing complex infrastructure issues where the root cause is not immediately obvious and may exist outside of an organization’s direct control.
Catchpoint, in contrast, represents a user-centric approach. It shifts the focus away from infrastructure behavior and toward real-world experience. By simulating user interactions and collecting data from actual users across different regions, devices, and network conditions, it captures how performance is perceived at the point of interaction. This perspective is essential in understanding whether users are able to complete tasks efficiently, whether applications respond consistently, and where friction occurs in digital journeys.
The key difference between the two platforms is not simply in their feature sets but in their perspective on what performance means. ThousandEyes asks, “Where in the network did something go wrong?” while Catchpoint asks, “How did the user experience break down?” Both questions are essential, but they serve different layers of analysis. One is rooted in infrastructure diagnosis, while the other is rooted in behavioral impact.
In real-world environments, these perspectives often overlap. A network routing issue identified by ThousandEyes may directly correlate with a spike in user abandonment detected by Catchpoint. Similarly, a slowdown in user experience observed through Catchpoint may lead engineers back to network-level diagnostics in ThousandEyes. This interconnected relationship highlights the fact that modern digital performance is multi-layered, and no single viewpoint is sufficient on its own.
Organizations operating at scale increasingly recognize that visibility must extend across both technical and experiential dimensions. Infrastructure health alone does not guarantee user satisfaction, and a smooth user experience cannot always be guaranteed without understanding the underlying network conditions. This is especially true in globally distributed systems where performance is influenced by cloud regions, third-party services, and internet routing behavior beyond organizational boundaries.
The decision between these platforms is therefore less about choosing one over the other and more about understanding operational priorities. Teams focused on deep network troubleshooting, internet behavior analysis, and infrastructure optimization tend to align more naturally with ThousandEyes. Teams focused on customer experience, application usability, and journey-based performance insights tend to align more with Catchpoint.
However, in many modern digital environments, these priorities are not mutually exclusive. Businesses often require both layers of insight to maintain reliability and deliver consistent user experiences. As a result, the most effective performance strategies are increasingly hybrid in nature, combining network intelligence with user experience visibility.
Ultimately, the evolution of tools like ThousandEyes and Catchpoint reflects the growing complexity of digital ecosystems. As applications become more distributed and user expectations continue to rise, the ability to see both the underlying infrastructure and the lived user experience becomes essential. Success in this environment depends not only on detecting issues but on understanding their full impact across the entire digital journey.