In modern cloud environments, visibility is no longer optional—it is a core requirement for maintaining reliability, security, and operational control. As organizations build increasingly complex architectures on AWS, they generate massive volumes of activity across services, applications, users, and automated systems. Without proper monitoring and logging, this activity becomes difficult to interpret, leaving gaps in understanding what is happening inside the infrastructure.
AWS provides multiple tools designed to address different aspects of observability. Some tools focus on capturing user actions and API calls, while others focus on infrastructure performance, system health, and application behavior. These tools work independently but are often used together to create a complete operational picture. Among them, AWS CloudTrail and AWS CloudWatch are two of the most widely used services, each serving a distinct purpose in cloud monitoring strategies.
Understanding how these services differ and complement each other requires first exploring the broader concept of observability. Observability is not just about collecting data; it is about making sense of system behavior through logs, metrics, and events. In AWS environments, this means tracking both who did something and how systems responded to that action. CloudTrail and CloudWatch align directly with these two perspectives.
The Role of Logging and Monitoring in Cloud Operations
Cloud computing introduces a dynamic environment where resources can be created, modified, or deleted within seconds. This flexibility improves efficiency but also increases complexity. Without monitoring systems in place, it becomes difficult to trace changes or understand system behavior after incidents occur.
Logging focuses on recording discrete actions that happen within a system. These logs act as historical records, allowing teams to trace events after they occur. Monitoring, on the other hand, focuses on real-time or near-real-time observation of system health and performance. It helps identify issues as they emerge rather than after they have already caused disruption.
In AWS environments, logging and monitoring are deeply interconnected. Logs provide the raw data, while monitoring systems analyze that data to generate insights, alerts, and automated responses. AWS CloudTrail primarily handles logging of account-level activities, while AWS CloudWatch is responsible for monitoring performance metrics and system health signals.
Introduction to AWS CloudTrail and Its Core Purpose
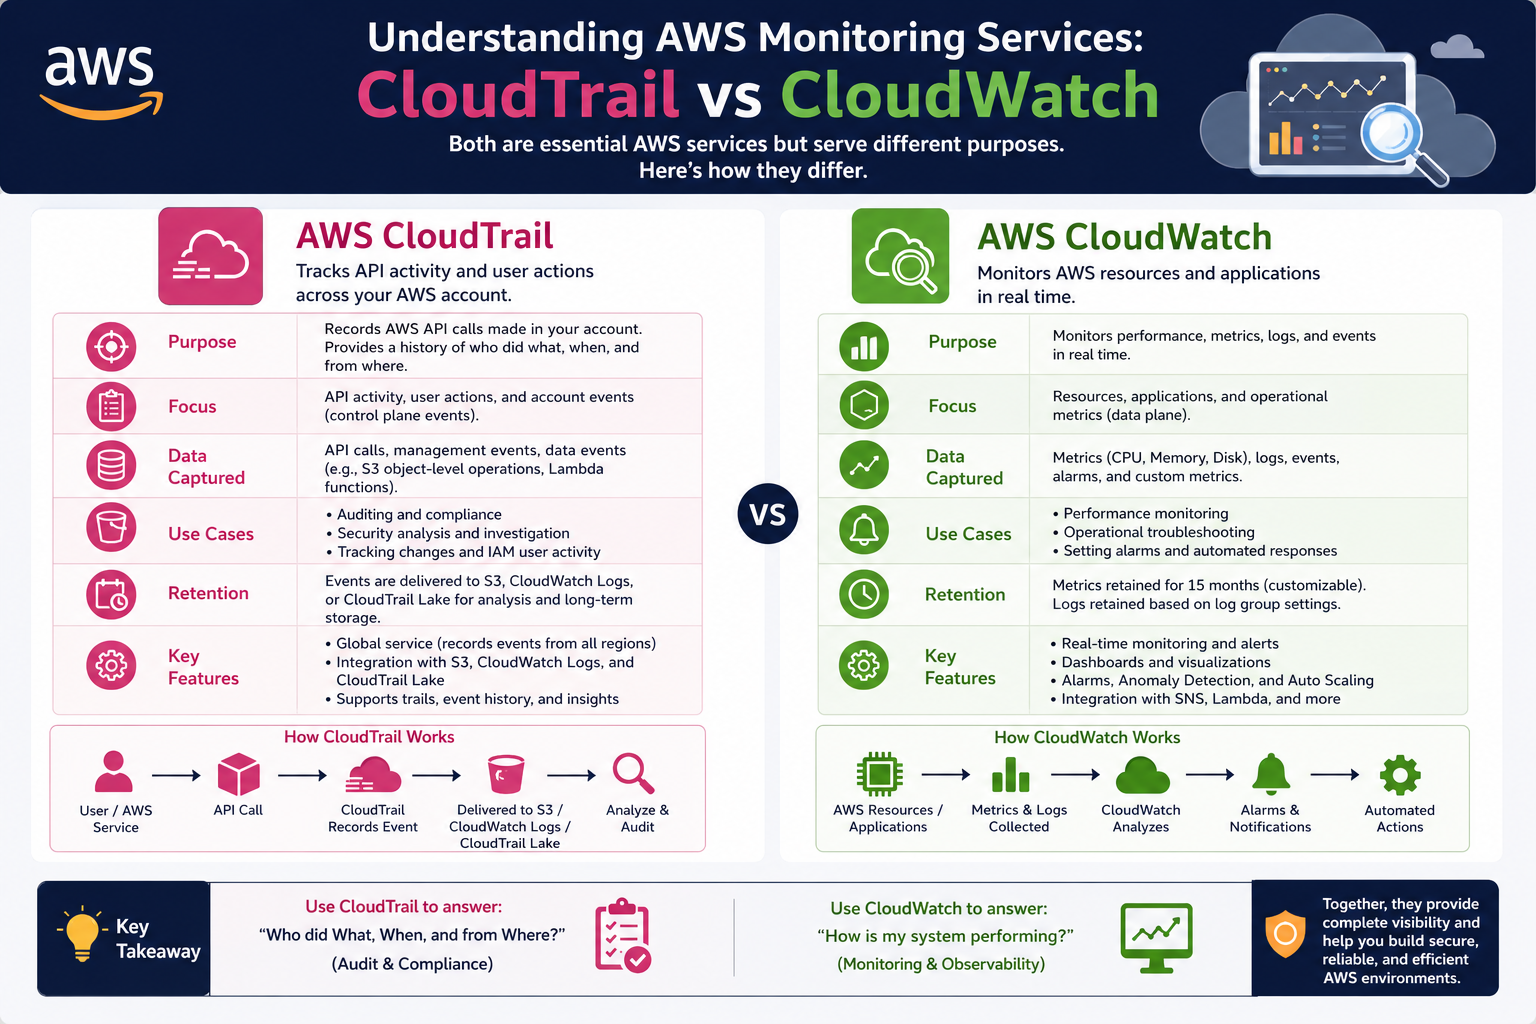
AWS CloudTrail is designed to record and track every action taken within an AWS account. It captures a detailed history of API calls made by users, services, and applications. This makes it an essential tool for auditing, governance, compliance, and security analysis.
At its core, CloudTrail answers three fundamental questions: who performed an action, what action was performed, and when it occurred. This level of detail is critical in environments where multiple users and automated systems interact with cloud resources continuously.
CloudTrail operates by capturing API activity across AWS services. Whenever a request is made—whether through the AWS Management Console, SDKs, command-line tools, or automated services—CloudTrail records the event. These records are then stored for later analysis and review.
Unlike performance monitoring tools, CloudTrail does not focus on system health or resource usage. Instead, it focuses entirely on activity tracking. This distinction makes it especially valuable for auditing and forensic investigations.
How AWS CloudTrail Captures and Records Activity
CloudTrail functions by continuously monitoring AWS account activity and recording it as events. Each event contains structured information about the request, including the identity of the requester, the service involved, the action taken, and metadata about the request context.
When a user acts, such as launching an instance, modifying a security group, or deleting a storage bucket, CloudTrail captures that API call. This event is then processed and stored in a log file.
These log files are delivered to a storage location where they can be reviewed, searched, or analyzed. The system ensures that activity is recorded in a consistent format, making it easier to trace patterns or investigate anomalies.
CloudTrail is not limited to manual user actions. It also records automated activity triggered by services, scripts, and applications. This makes it a comprehensive source of truth for all activity within an AWS account. It also includes detailed timestamps, source IP addresses, and request parameters, which help security teams reconstruct events accurately during audits or incident investigations. Over time, these logs build a historical record that supports compliance requirements and forensic analysis.
Types of Events Tracked in CloudTrail
CloudTrail categorizes events into different types to help organize and interpret activity more effectively.
The first category is management events. These involve operations that manage resources within an AWS account, such as creating, modifying, or deleting services. For example, launching a new virtual machine or updating access permissions would fall under this category.
The second category is data events. These are higher-volume activities that occur within resources, such as object-level operations in storage services or invocation of functions in serverless environments. Data events provide deeper visibility into how resources are being used.
The third category is insight events. These are generated through analysis of normal activity patterns. CloudTrail Insights uses machine learning techniques to detect unusual behavior, such as spikes in resource creation or unexpected API usage patterns.
Together, these event types create a layered view of account activity, ranging from high-level administrative changes to detailed operational behavior.
CloudTrail Event Lifecycle and Data Handling
Once an event is captured, CloudTrail processes and stores it for later use. The event lifecycle begins with detection, where the API call is identified and recorded. It then moves into processing, where the event is structured into a standardized format.
After processing, events are delivered to a storage destination where they are preserved for auditing and analysis. These logs can be retained for extended periods depending on configuration and compliance requirements.
One important aspect of CloudTrail is its delay in event delivery. Events are not always available instantly; there is typically a short processing window before they appear in logs. This delay is usually brief but important to consider when performing real-time investigations.
CloudTrail also integrates with analytics tools that allow deeper exploration of log data. This enables teams to query historical activity and identify patterns over time, especially when investigating security incidents or operational anomalies.
Security and Governance Applications of CloudTrail
One of the most important uses of CloudTrail is in security monitoring. By maintaining a detailed record of all account activity, CloudTrail enables organizations to detect unauthorized access, track configuration changes, and investigate suspicious behavior.
If a security incident occurs, CloudTrail provides a forensic trail that shows exactly what happened before, during, and after the event. This includes identifying which user or system initiated changes and what resources were affected.
CloudTrail also plays a key role in governance and compliance. Many regulatory frameworks require organizations to maintain detailed logs of system activity. CloudTrail helps meet these requirements by providing an auditable record of all actions performed within an AWS environment.
In addition, CloudTrail supports operational troubleshooting. When systems behave unexpectedly, logs can be reviewed to identify recent changes that may have contributed to the issue. This makes it easier to pinpoint root causes without guesswork.
Introduction to AWS CloudWatch and Its Broader Role
While CloudTrail focuses on tracking account activity, AWS CloudWatch serves a different purpose. It is designed to monitor the performance and health of AWS resources and applications.
CloudWatch collects metrics such as CPU utilization, memory usage, network traffic, and application response times. These metrics provide real-time insights into how systems are performing under different conditions.
Unlike CloudTrail, which records discrete events, CloudWatch focuses on continuous measurement. It aggregates data over time and presents it in a way that helps identify trends, spikes, and performance issues.
CloudWatch also introduces the concept of alarms. These alarms allow users to define thresholds for specific metrics. When those thresholds are breached, CloudWatch can trigger notifications or automated actions.
Although CloudWatch and CloudTrail serve different purposes, they often work together. CloudTrail provides the detailed activity history, while CloudWatch interprets performance and operational behavior based on that activity.
Early Distinction Between CloudTrail and CloudWatch
Even at a foundational level, the difference between these two services becomes clear. CloudTrail is centered on account activity tracking, answering questions about actions taken within the system. CloudWatch is centered on system performance monitoring, answering questions about how well systems are functioning.
CloudTrail operates at the API and identity level, while CloudWatch operates at the infrastructure and application level. One focuses on auditing, while the other focuses on operational health.
This distinction is critical when designing monitoring strategies in AWS environments, as each tool addresses a different layer of visibility.
Expanding Observability Beyond Logging in AWS Environments
As AWS environments scale, basic logging becomes insufficient for maintaining operational control. Modern cloud systems are no longer static infrastructures; they are dynamic ecosystems where compute resources, storage layers, network configurations, and application components continuously interact. In such environments, understanding what happened is only part of the challenge. Equally important is understanding how systems behave over time and how performance changes under different conditions.
This is where monitoring evolves beyond simple log collection into full observability. Observability combines metrics, logs, and events into a unified system of insight. While logging focuses on recording discrete actions, monitoring focuses on continuous evaluation of system behavior. AWS CloudWatch plays a central role in this transformation by providing structured visibility into performance, resource utilization, and system health.
Unlike traditional monitoring tools that operate in isolation, CloudWatch is deeply integrated into AWS services. It does not simply collect data; it interprets system behavior through metrics and triggers automated responses when conditions change. This makes it essential for maintaining stability in distributed cloud environments.
The Core Philosophy Behind AWS CloudWatch
AWS CloudWatch is built around the idea that systems should not only be observed but also understood in real time. It collects operational data from AWS services, applications, and infrastructure components, then transforms that data into actionable insights.
At its core, CloudWatch focuses on performance awareness. Instead of tracking user actions like CloudTrail, it tracks system behavior such as CPU load, memory consumption, latency, request counts, and error rates. These indicators provide a continuous stream of information about how systems are performing under varying workloads.
CloudWatch is not limited to AWS-native services. It can also ingest data from on-premises systems and hybrid environments, making it a centralized monitoring hub for diverse infrastructures. This flexibility allows organizations to maintain consistent visibility even as their architectures expand across multiple environments.
The underlying philosophy of CloudWatch is proactive monitoring. Rather than reacting to failures after they occur, CloudWatch enables systems to detect early warning signs and respond automatically. This shift from reactive to proactive operations is a defining characteristic of modern cloud engineering.
How CloudWatch Collects and Processes Metrics
CloudWatch operates by collecting metrics from multiple sources across an AWS environment. These metrics are numerical representations of system behavior, such as how many requests a service processes per second or how much memory an instance consumes.
Each AWS service publishes its own set of default metrics to CloudWatch. For example, compute services provide CPU and disk usage metrics, while storage services provide read/write operation counts. These metrics are collected at regular intervals and stored for analysis.
Once collected, metrics are organized into time-series data. This means each metric is associated with a timestamp, allowing CloudWatch to visualize changes over time. This time-based structure is essential for identifying trends, anomalies, and performance degradation.
CloudWatch also allows custom metrics. Applications can publish their own performance data, enabling developers to monitor business-specific indicators such as transaction volumes, user activity levels, or processing delays. This extends CloudWatch beyond infrastructure monitoring into application-level observability.
CloudWatch Logs and Their Role in System Visibility
In addition to metrics, CloudWatch also collects logs. Logs provide detailed records of events that occur within applications and systems. While metrics provide numerical summaries, logs provide granular context.
CloudWatch Logs can capture output from applications, system processes, and AWS services. These logs are then stored and made searchable, allowing teams to analyze system behavior at a detailed level.
Logs are particularly useful when diagnosing issues that cannot be understood through metrics alone. For example, a spike in error rates may be visible in metrics, but logs reveal the exact cause of those errors.
CloudWatch Logs also supports filtering and grouping, allowing large volumes of log data to be organized into meaningful categories. This makes it easier to identify recurring issues or patterns in system behavior.
CloudWatch Alarms and Automated Response Systems
One of the most powerful features of CloudWatch is its alarm system. Alarms allow users to define thresholds for specific metrics. When those thresholds are exceeded or not met, CloudWatch triggers a response.
These responses can take several forms. They may send notifications to administrators, trigger automated scaling actions, or invoke other AWS services. This enables systems to react dynamically to changing conditions.
For example, if CPU usage on a server exceeds a defined limit, CloudWatch can automatically trigger the launch of additional compute resources. This ensures that performance remains stable even under increased demand.
Alarms are not limited to performance metrics. They can also be configured to respond to operational signals such as error rates, request failures, or latency spikes. This makes them a central component of automated cloud operations.
However, alarm configuration requires careful planning. Poorly defined thresholds can lead to excessive alerts, while overly relaxed thresholds may delay critical responses. Proper tuning is essential for maintaining a balance between sensitivity and stability.
CloudWatch Events and Event-Driven Architecture
CloudWatch also plays a role in event-driven architectures through its event monitoring capabilities. Events represent changes in system state, such as resource modifications, scheduled operations, or service updates.
These events can be used to trigger automated workflows. For example, when a resource is created or modified, an event can initiate a validation process or security check.
Event-driven systems are particularly valuable in large-scale cloud environments where manual monitoring is not feasible. By responding automatically to system changes, organizations can maintain consistency and reduce operational overhead.
CloudWatch integrates tightly with other AWS services to enable these workflows. Events generated within CloudWatch can trigger functions, workflows, or messaging systems, creating a fully automated response chain.
Real-Time Monitoring and Performance Optimization
CloudWatch enables real-time monitoring of system performance, which is essential for maintaining application reliability. Real-time data allows teams to detect performance bottlenecks as they occur rather than after users are affected.
For example, if a web application experiences increased latency, CloudWatch metrics can immediately reveal whether the issue is related to compute resources, network congestion, or database performance.
This real-time visibility allows teams to make informed decisions quickly. Instead of relying on historical reports, engineers can respond to live system behavior and adjust configurations as needed.
Performance optimization also becomes more structured with CloudWatch. By analyzing historical metrics, teams can identify recurring performance patterns and adjust resource allocation accordingly.
CloudWatch Dashboards and Visual Representation of Data
To make monitoring more accessible, CloudWatch provides dashboards that visually represent metrics and logs. These dashboards allow users to view system health at a glance without manually analyzing raw data.
Dashboards can be customized to display key performance indicators, application metrics, or infrastructure statistics. This makes it easier for teams to monitor multiple systems simultaneously.
Visual representation is particularly important in complex environments where multiple services interact. Dashboards consolidate data into a single view, improving situational awareness.
By organizing metrics into charts and graphs, CloudWatch helps transform raw data into meaningful insights. This improves decision-making and reduces the time required to diagnose issues.
Integration of CloudWatch with Application-Level Monitoring
CloudWatch is not limited to infrastructure monitoring; it also supports application-level observability. Applications can send custom logs and metrics directly to CloudWatch, enabling developers to track business logic performance.
This integration allows organizations to monitor both technical and functional aspects of their systems. For example, an e-commerce application can track not only server performance but also transaction success rates and user activity flows.
Application-level monitoring is essential for understanding how software behaves in real-world conditions. It bridges the gap between infrastructure performance and user experience.
By combining infrastructure metrics with application data, CloudWatch provides a complete view of system behavior from multiple perspectives.
CloudWatch in Hybrid and Multi-Environment Architectures
Modern organizations often operate across hybrid environments that include both cloud and on-premises systems. CloudWatch supports this complexity by allowing external systems to send metrics and logs into its monitoring framework.
This capability ensures that monitoring remains centralized even when infrastructure is distributed across different environments. It eliminates the need for separate monitoring systems for each platform.
In multi-cloud or hybrid architectures, consistency is critical. CloudWatch helps maintain standardized monitoring practices across all systems, ensuring that performance data is interpreted uniformly.
This unified approach simplifies operations and reduces fragmentation in monitoring strategies.
Relationship Between Metrics, Logs, and Insights in CloudWatch
CloudWatch operates through a combination of metrics, logs, and insights. Metrics provide quantitative data, logs provide contextual information, and insights help interpret patterns across both.
Together, these components form a layered understanding of system behavior. Metrics show what is happening, logs explain why it is happening, and insights reveal patterns over time.
This layered structure is essential for diagnosing complex issues. For example, a performance drop may appear in metrics, but logs reveal configuration changes, while insights identify recurring patterns that suggest deeper architectural problems.
CloudWatch uses this combination of data types to support both real-time monitoring and long-term analysis.
Operational Challenges in Large-Scale CloudWatch Environments
As systems grow, CloudWatch implementations can become complex. Large volumes of metrics and logs may lead to data overload if not properly managed.
One common challenge is excessive alerting. If alarms are not carefully configured, they may generate too many notifications, reducing their effectiveness. This can lead to alert fatigue, where important signals are overlooked.
Another challenge is data retention. Storing large volumes of logs and metrics requires careful planning to balance cost and accessibility. Organizations must decide how long data should be retained and how frequently it should be analyzed.
Despite these challenges, CloudWatch remains a central component of AWS monitoring strategies due to its scalability and integration capabilities.
Bridging the Gap Between Activity Tracking and System Monitoring
In complex AWS environments, no single monitoring tool is sufficient to provide full visibility into operations. CloudTrail and CloudWatch are often misunderstood as competing services, but in reality, they operate at different layers of the system and serve complementary roles. CloudTrail focuses on account-level activity tracking, while CloudWatch focuses on system-level performance monitoring. When combined, they create a unified observability model that spans both human and machine behavior.
Modern cloud architectures depend on this layered visibility. Systems are no longer static servers performing isolated tasks; they are interconnected services that respond dynamically to user actions, automated processes, and infrastructure scaling events. Without a clear distinction between what was done and how the system reacted, diagnosing issues becomes significantly more difficult.
CloudTrail provides the historical record of actions, including identity, API calls, and configuration changes. CloudWatch interprets the operational state of systems in real time. Together, they form a complete narrative of system behavior.
How CloudTrail and CloudWatch Complement Each Other in Practice
Although CloudTrail and CloudWatch operate independently, they are frequently used together in real-world environments to create end-to-end observability. The combination allows teams to correlate user actions with system performance changes.
For example, if a system experiences a sudden performance drop, CloudWatch metrics may reveal increased latency or resource saturation. However, CloudWatch alone cannot explain why this change occurred. CloudTrail fills this gap by showing whether any configuration changes, deployments, or user actions triggered the issue.
This complementary relationship is especially important in troubleshooting scenarios. CloudWatch identifies symptoms, while CloudTrail helps uncover root causes. This dual-layer approach reduces investigation time and improves accuracy when diagnosing incidents.
In security contexts, this integration becomes even more powerful. CloudWatch may detect unusual activity patterns, while CloudTrail identifies the exact user or service responsible for those actions. Together, they enable rapid detection and response to security incidents.
Mapping Responsibility: Identity vs Infrastructure Perspective
One of the most important distinctions between CloudTrail and CloudWatch is the level at which they operate within the system architecture.
CloudTrail operates at the identity and API level. It answers questions such as who accessed a resource, what action was taken, and from where the request originated. It is fundamentally focused on accountability and traceability of actions within an AWS account.
CloudWatch operates at the infrastructure and application level. It answers questions about system health, performance, and resource utilization. It is focused on operational stability rather than user accountability.
This separation of responsibility is critical in distributed systems. Identity-level tracking ensures security and governance, while infrastructure-level monitoring ensures performance and reliability. When combined, they provide a full-stack view of system behavior.
Incident Response Workflows Using CloudTrail and CloudWatch
Incident response in AWS environments relies heavily on the interaction between CloudTrail and CloudWatch. When an issue occurs, the first step is often detection through CloudWatch alarms. These alarms indicate abnormal system behavior, such as increased error rates, degraded performance, or resource exhaustion.
Once an anomaly is detected, CloudTrail becomes the investigative tool. It is used to reconstruct the sequence of actions leading up to the incident. This includes identifying configuration changes, user activity, and automated service interactions.
A typical incident response workflow begins with CloudWatch alerting administrators to a problem. From there, CloudTrail logs are analyzed to determine whether recent changes contributed to the issue. This process allows teams to quickly narrow down potential causes.
For example, if a database becomes unresponsive, CloudWatch may show increased latency and failed connections. CloudTrail may then reveal that a security group was modified shortly before the issue began. This correlation is critical for identifying root causes.
Security Monitoring Across CloudTrail and CloudWatch
Security monitoring in AWS environments requires visibility into both user behavior and system response. CloudTrail and CloudWatch contribute to this in different but interconnected ways.
CloudTrail provides a detailed audit trail of all API activity. This includes login attempts, permission changes, resource creation, and deletion events. It ensures that every action is recorded and traceable.
CloudWatch, on the other hand, monitors security-related metrics and behavioral patterns. It can track anomalies such as sudden spikes in failed authentication attempts, unusual traffic patterns, or resource usage irregularities.
When integrated, these services allow for advanced security monitoring. CloudWatch can trigger alerts based on suspicious behavior patterns, while CloudTrail provides forensic data to investigate those alerts.
This combination is especially useful in detecting insider threats, compromised credentials, or misconfigurations that expose security vulnerabilities.
Automated Security Response Using CloudWatch and CloudTrail Data
Automation plays a critical role in modern cloud security. CloudWatch can be configured to respond automatically to certain conditions, while CloudTrail provides the context needed to validate those conditions.
For example, if CloudWatch detects multiple failed login attempts, it can trigger an automated response such as disabling access or notifying security teams. CloudTrail logs can then be used to determine the source and pattern of those login attempts.
This integration enables a proactive security posture. Instead of waiting for manual investigation, systems can respond immediately to potential threats.
Automation also reduces response time during critical incidents. By combining real-time monitoring with historical activity logs, AWS environments can react quickly and intelligently to security events.
Performance Optimization Through Combined Observability
Performance optimization in AWS is not limited to analyzing system metrics. It also involves understanding the changes that lead to performance fluctuations.
CloudWatch provides real-time and historical performance data, allowing teams to identify bottlenecks and inefficiencies. However, performance issues often arise due to configuration changes, deployment updates, or scaling events.
CloudTrail provides the missing context by showing what changes occurred in the environment. This includes updates to instance configurations, service deployments, or infrastructure modifications.
By combining these insights, teams can correlate performance changes with specific system actions. This enables more precise optimization strategies and reduces guesswork in troubleshooting.
For example, a sudden increase in latency may be traced back to a recent configuration change recorded in CloudTrail. CloudWatch identifies the symptom, while CloudTrail explains the cause.
Role of CloudTrail and CloudWatch in DevOps Pipelines
In DevOps environments, continuous integration and continuous deployment rely heavily on automation and monitoring. CloudTrail and CloudWatch both play essential roles in ensuring pipeline stability and reliability.
CloudTrail tracks all deployment-related actions, including infrastructure provisioning, configuration changes, and access modifications. This ensures that every change introduced through the pipeline is recorded and traceable.
CloudWatch monitors the performance of applications after deployment. It ensures that new releases do not negatively impact system stability or user experience.
Together, they provide end-to-end visibility across the software delivery lifecycle. CloudTrail ensures accountability in deployment processes, while CloudWatch ensures operational performance post-deployment.
This combination is critical for maintaining reliable and scalable DevOps workflows.
Event Correlation Between CloudTrail and CloudWatch
Event correlation is the process of linking related activities across different monitoring systems. In AWS, this involves connecting CloudTrail events with CloudWatch metrics and alarms.
For example, a configuration change recorded in CloudTrail may be correlated with a performance spike detected in CloudWatch. This correlation helps identify cause-and-effect relationships between system actions and performance outcomes.
Event correlation is particularly useful in complex architectures where multiple services interact simultaneously. Without correlation, it becomes difficult to determine which events are responsible for system behavior changes.
By combining data from both services, teams can build a timeline of events that explains system behavior in detail.
Scalability Challenges in Large AWS Monitoring Environments
As AWS environments grow, both CloudTrail and CloudWatch face scalability challenges. CloudTrail generates large volumes of event data, especially in environments with high API activity. Managing and analyzing this data efficiently requires careful planning.
CloudWatch also generates significant amounts of metric and log data. As the number of monitored resources increases, so does the complexity of managing alarms, dashboards, and data retention policies.
One challenge is maintaining the signal-to-noise ratio. Too many logs or alarms can overwhelm teams, making it harder to identify meaningful insights. Proper filtering and aggregation strategies are necessary to maintain clarity.
Another challenge is cost management. Both services generate charges based on data volume and storage duration. Efficient configuration is essential to balance visibility with cost control.
Hybrid and Multi-Account Monitoring Strategies
In enterprise environments, AWS usage is often distributed across multiple accounts and regions. CloudTrail and CloudWatch support these architectures through centralized monitoring strategies.
CloudTrail can aggregate logs from multiple accounts into a single location, enabling centralized auditing and governance. This ensures consistent visibility across all environments.
CloudWatch can also aggregate metrics and logs from multiple sources, providing a unified operational view. This is particularly important in large organizations with distributed teams and workloads.
Centralized monitoring simplifies operations and improves consistency in incident response and performance management.
Evolution of Observability Through CloudTrail and CloudWatch Integration
Over time, AWS monitoring has evolved from simple logging systems to fully integrated observability platforms. CloudTrail and CloudWatch represent two foundational pillars of this evolution.
CloudTrail introduced accountability and traceability into cloud environments by recording every API action. CloudWatch introduced real-time performance monitoring and automated response capabilities.
Together, they form a comprehensive system that supports modern cloud operations. Their integration enables organizations to move beyond reactive troubleshooting and toward proactive system management.
This evolution reflects a broader shift in cloud computing toward automation, intelligence, and continuous optimization of infrastructure behavior.
Advanced Log Architecture and Data Flow Optimization in AWS
As AWS environments scale, the way logs and metrics are structured, transported, and stored becomes increasingly important. CloudTrail and CloudWatch generate large volumes of operational data, and without an efficient architecture for handling this data, organizations can quickly face performance bottlenecks and unnecessary cost increases.
In optimized AWS environments, log data is not treated as a static output but as a flowing stream of information that moves through multiple processing stages. CloudTrail events are typically delivered to centralized storage locations where they can be indexed, queried, and archived. CloudWatch logs and metrics follow a similar lifecycle but are often processed in near real-time to support monitoring dashboards and alarm systems.
A well-designed architecture ensures that only relevant data is retained at high-frequency access levels, while older or less critical data is moved to cost-efficient storage tiers. This separation allows organizations to maintain visibility without overwhelming storage systems or incurring high costs.
Another key aspect of log architecture is normalization. CloudTrail and CloudWatch produce different types of structured data, but integrating them into a unified format enables easier correlation. When logs and metrics share a common structure or tagging system, it becomes significantly easier to analyze system behavior across multiple dimensions.
Efficient data flow design also reduces noise. Instead of processing every event with equal priority, systems can prioritize high-impact signals such as security changes or performance anomalies. This selective processing ensures that critical insights are not lost in large datasets.
Security Intelligence and Threat Detection Correlation Models
Security monitoring in AWS environments has evolved beyond simple alerting into structured threat detection models. CloudTrail and CloudWatch together play a central role in building these models by providing both behavioral and performance-based indicators.
CloudTrail contributes identity-driven intelligence by tracking authentication events, permission changes, and API usage patterns. This data helps identify unusual access behavior, such as unexpected privilege escalation or access from unfamiliar locations.
CloudWatch contributes system-driven intelligence by monitoring operational anomalies such as sudden spikes in traffic, unusual resource consumption, or repeated system failures. These indicators often serve as early warning signs of potential security incidents.
When combined, these two data sources enable correlation-based threat detection. Instead of reacting to isolated signals, systems analyze patterns across both identity and infrastructure layers. For example, a login anomaly detected in CloudTrail combined with unusual network traffic observed in CloudWatch may indicate a compromised account.
Advanced security models often assign risk scores to combined events. CloudTrail events contribute identity risk factors, while CloudWatch metrics contribute behavioral risk factors. This scoring system helps prioritize alerts and reduce false positives.
This layered approach significantly improves detection accuracy, especially in environments where attackers attempt to blend malicious activity with normal system behavior.
Cost Governance and Resource Efficiency in Monitoring Systems
As monitoring systems scale, cost management becomes a critical operational concern. Both CloudTrail and CloudWatch generate costs based on data ingestion, storage, and processing. Without proper governance, monitoring systems themselves can become a significant expense.
CloudTrail costs are often influenced by the volume of API activity and the retention period of logs. High-frequency environments with large numbers of automated operations can generate substantial log data. Efficient filtering and selective logging strategies help reduce unnecessary data capture.
CloudWatch costs are primarily driven by metrics, log ingestion, and alarm configurations. High-resolution metrics and excessive logging can significantly increase usage costs. Similarly, poorly optimized alarms can generate unnecessary notifications and processing overhead.
Cost governance in monitoring systems involves balancing visibility with efficiency. Not every metric or event needs to be tracked at maximum granularity. Instead, organizations must identify critical signals that directly impact operational or business outcomes.
Another important strategy is lifecycle management. Older logs and metrics can be archived or compressed to reduce storage costs while still maintaining historical access for auditing purposes.
By implementing structured retention policies and prioritizing high-value data streams, organizations can maintain strong observability without excessive financial overhead.
Machine Learning and Predictive Analytics in AWS Monitoring
Modern AWS monitoring systems increasingly incorporate machine learning to enhance anomaly detection and predictive analysis. CloudWatch and CloudTrail data provide a rich foundation for these models because they contain both historical patterns and real-time signals.
Machine learning models can analyze CloudWatch metrics to identify trends that indicate future performance degradation. For example, gradual increases in latency or resource utilization may signal upcoming capacity issues before they become critical.
Similarly, CloudTrail data can be used to detect deviations in user behavior. If a user typically performs a limited set of actions but suddenly begins executing high-impact API calls, this deviation can be flagged as potentially suspicious.
Predictive analytics extends beyond detection into forecasting. Systems can estimate future resource demands based on historical usage patterns and automatically adjust infrastructure accordingly.
This integration of machine learning transforms monitoring from reactive observation into proactive optimization. Instead of responding to issues after they occur, systems anticipate and prevent them.
Multi-Layered Incident Forensics and Root Cause Analysis
Incident forensics in AWS environments requires a structured approach that combines multiple data sources. CloudTrail and CloudWatch together provide a layered view of system behavior that is essential for root cause analysis.
The forensic process typically begins with identifying the symptom through CloudWatch metrics. This may include performance degradation, error spikes, or system unavailability. Once the symptom is identified, CloudTrail logs are used to reconstruct the timeline of events leading up to the issue.
This timeline often reveals critical changes such as configuration updates, deployment events, or access modifications. By aligning these events with performance changes, investigators can identify the root cause of the incident.
Advanced forensic analysis also involves correlation across multiple services. For example, a single incident may involve compute resources, storage systems, and networking components. CloudWatch provides performance insights across these layers, while CloudTrail provides a unified record of actions affecting them.
This multi-layered approach significantly improves investigation accuracy and reduces resolution time. It also supports deeper post-incident reviews, where teams analyze recurring patterns to prevent similar issues in the future. Over time, this builds stronger operational resilience and helps organizations refine both their monitoring strategies and system design decisions for greater stability.
Evolving Role of Observability in Distributed Cloud Systems
As cloud systems continue to evolve into highly distributed architectures, observability is becoming more complex and more essential. Systems now consist of microservices, serverless functions, containerized workloads, and cross-region deployments.
In such environments, traditional monitoring approaches are insufficient. CloudTrail and CloudWatch must operate at scale, handling large volumes of distributed data while maintaining consistency and accuracy.
Observability in distributed systems requires correlation across multiple dimensions, including time, identity, performance, and dependency mapping. CloudTrail provides identity and action-based correlation, while CloudWatch provides performance-based correlation.
Together, they enable a holistic understanding of distributed system behavior. This is particularly important in environments where failures are not isolated but propagate across services.
Modern observability frameworks rely heavily on these combined signals to maintain system reliability and operational clarity in highly dynamic environments.
Conclusion
AWS CloudTrail and AWS CloudWatch represent two foundational pillars of observability within modern cloud computing environments, each addressing a different but equally important dimension of system visibility. CloudTrail is primarily focused on accountability, governance, and security auditing by recording every API call and user action within an AWS account. It provides a clear historical record of “who did what and when,” making it indispensable for compliance requirements, forensic investigations, and operational auditing.
In contrast, CloudWatch is centered on performance monitoring, system health, and real-time operational awareness. It collects metrics, logs, and events that reflect how AWS resources and applications are behaving under different workloads. Through alarms, dashboards, and automated responses, CloudWatch enables proactive system management, allowing teams to detect and resolve issues before they escalate into critical failures.
When viewed independently, each service delivers significant value. However, their true strength emerges when they are used together. CloudTrail provides the context behind system changes, while CloudWatch reveals the impact of those changes on performance and stability. This combination allows organizations to build a complete observability framework that spans both user activity and infrastructure behavior.
In real-world AWS architectures, this integration supports faster incident response, stronger security posture, and more efficient performance optimization. Teams can quickly correlate configuration changes with system anomalies, identify root causes with greater accuracy, and automate responses to maintain system reliability at scale.
As cloud environments continue to grow in complexity, the need for comprehensive visibility becomes increasingly critical. Relying on a single monitoring approach is no longer sufficient. Instead, organizations must adopt layered observability strategies where CloudTrail and CloudWatch work in harmony to deliver end-to-end insight.
Ultimately, mastering the combined use of these services is essential for building secure, scalable, and resilient cloud infrastructures that can adapt effectively to the demands of modern digital operations. Their integration also strengthens long-term operational maturity by enabling continuous improvement, better decision-making, and more intelligent infrastructure management across evolving cloud ecosystems.