Traceroute is one of the most essential diagnostic utilities available in modern networking environments, especially within the ecosystem of Linux. It is designed to reveal the exact path that data packets travel when moving from a source system to a destination host on a network or across the internet. At its core, traceroute helps users understand not just whether a destination is reachable, but how the connection is being established step by step across multiple intermediary devices.
In practical terms, every time you load a website, send a request to a server, or access a remote system, your data does not travel in a straight line. Instead, it passes through a series of routers and networking devices, each acting as a checkpoint. These checkpoints are known as hops. Traceroute exposes these hops in sequence, allowing users to see each stage of the journey.
What makes traceroute especially valuable is its ability to transform complex network behavior into readable, structured output. Instead of guessing where delays or failures occur, system administrators and engineers can visually trace the route and identify where problems begin. This makes it a fundamental tool for diagnosing slow connections, packet loss, or routing issues.
Unlike basic connectivity tools that only confirm whether a destination is reachable, traceroute provides deeper insight into performance. It shows timing information, intermediate nodes, and sometimes even where traffic is being rerouted. This level of visibility is crucial in environments where uptime, speed, and reliability are critical.
Importance of Traceroute in Network Diagnostics
Modern networks are highly complex systems composed of multiple interconnected layers, service providers, and routing policies. In such environments, identifying the root cause of a connectivity issue can be challenging. This is where traceroute becomes indispensable.
One of the key reasons traceroute is important is its ability to pinpoint where delays occur along a network path. If a connection to a remote server is slow, the issue might not be with the destination itself. Instead, it could be caused by congestion or malfunction at an intermediate router. Traceroute helps isolate these points of failure by showing response times at each hop.
Another critical use of traceroute is in detecting routing inefficiencies. Sometimes, data packets take longer-than-expected paths due to suboptimal routing configurations. This can result in unnecessary latency. By analyzing the route displayed by traceroute, network engineers can identify whether traffic is taking an indirect path and investigate potential configuration issues.
Traceroute is also valuable for identifying network interruptions caused by security policies. Firewalls and access control systems may block certain types of traffic, resulting in incomplete traces or missing hops. While this can initially appear as a network failure, traceroute helps distinguish between actual outages and intentional filtering.
Additionally, traceroute plays a key role in collaboration between network administrators and service providers. When users report connectivity issues, traceroute results provide concrete evidence of where the problem lies, making troubleshooting more efficient and precise.
How Traceroute Works Internally
The functionality of traceroute is based on a fundamental networking concept known as Time To Live (TTL). Every data packet sent across a network contains a TTL value, which determines how many hops it can traverse before being discarded. Each router that handles the packet reduces the TTL by one. When the TTL reaches zero, the packet is dropped, and an error message is sent back to the sender.
Traceroute takes advantage of this behavior by deliberately manipulating TTL values. It begins by sending a packet with a TTL of 1. This means the first router it encounters will immediately discard the packet and return a notification. Traceroute records this first router as the initial hop.
Next, it sends another packet with a TTL of 2. This allows the packet to pass through the first router but be stopped by the second one. Again, the second router responds with an error message, which traceroute records. This process continues, gradually increasing the TTL value with each iteration, revealing each successive router along the path.
This incremental approach allows traceroute to map the entire route from source to destination. Eventually, when the packet reaches its final destination, the process completes because the destination system responds differently, indicating successful delivery.
Each response received by traceroute also includes timing information. This allows the tool to measure how long each hop takes, providing insight into network latency. If a particular hop shows unusually high response times, it may indicate congestion or hardware performance issues at that point in the network.
In many implementations, traceroute sends multiple probes at each TTL level to improve accuracy. This helps account for variations in network performance and ensures that the results are reliable.
Key Output Elements and What They Mean
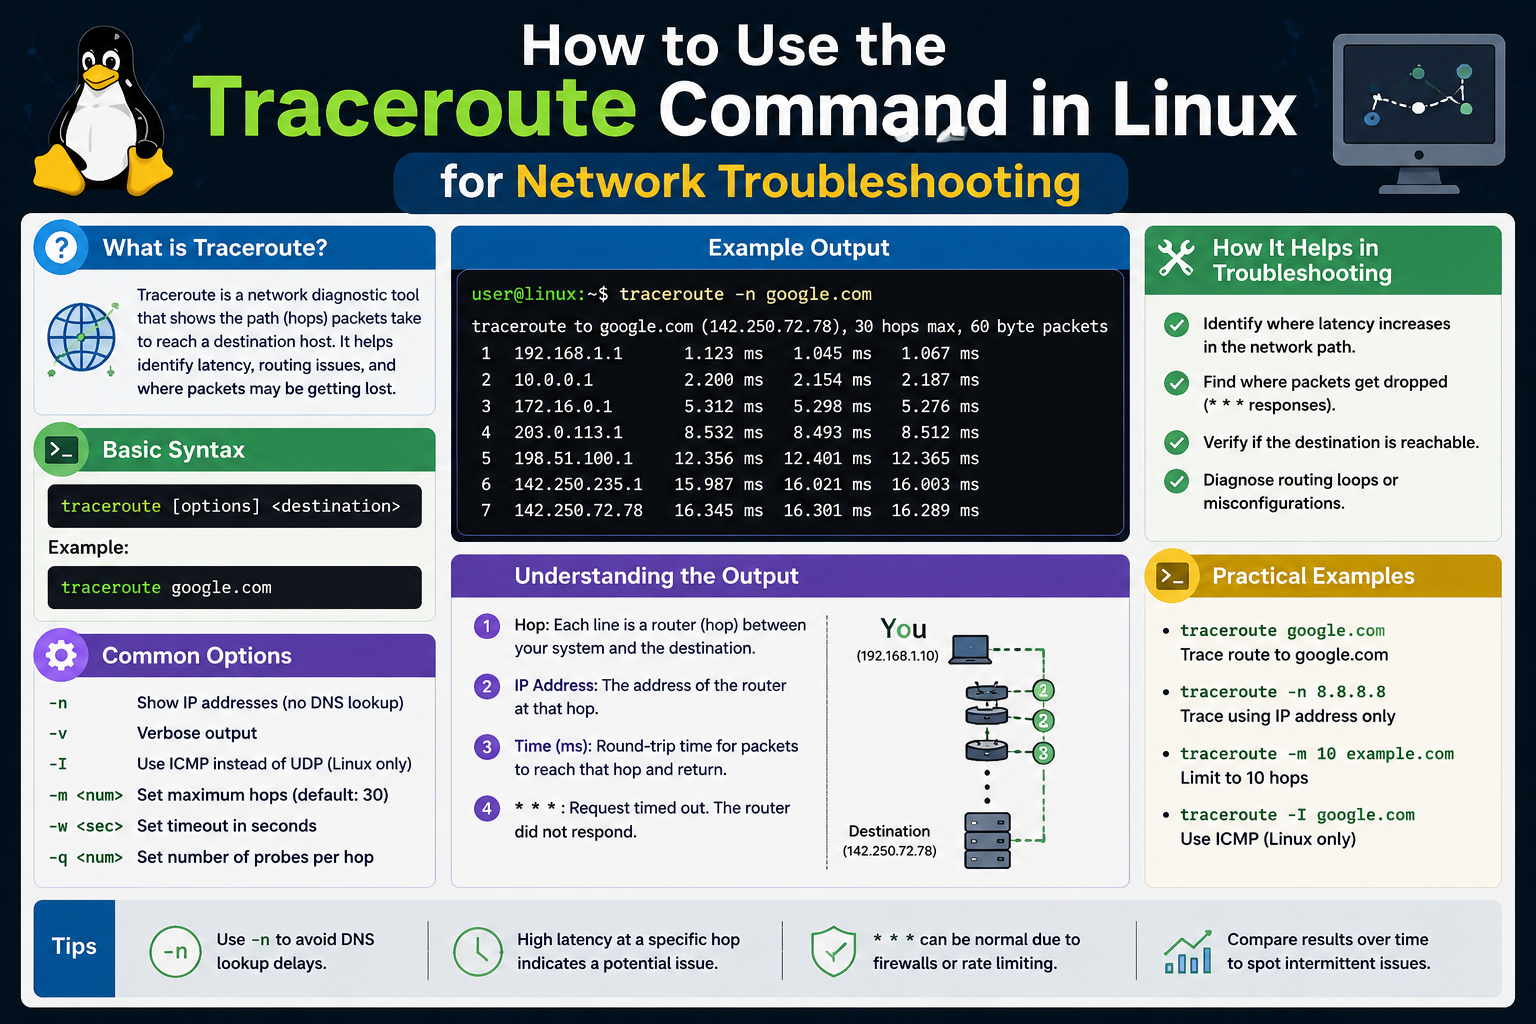
The output of traceroute is structured in a way that provides both route visibility and performance metrics. Each line in the output represents a hop in the network path, and each hop contains several important pieces of information.
The first element is the hop number, which indicates the position of the router in the sequence. This helps users understand how far along the network path each device is located.
Next is the address information, which typically includes either an IP address or a hostname. When available, the hostname provides a human-readable label for the device, making it easier to identify the network infrastructure involved. In some cases, only IP addresses are shown, especially when name resolution is disabled or unavailable.
The most critical component of traceroute output is the response time data. Each hop usually displays multiple timing values, representing the round-trip time for packets sent to that router. These values are measured in milliseconds and indicate how quickly each network segment responds.
When response times increase significantly at a particular hop, it often signals a potential bottleneck. However, it is important to interpret these values carefully, as temporary congestion or network load can also affect results.
Occasionally, traceroute may display asterisks instead of response times. This indicates that a response was not received within the expected timeframe. While this can suggest packet loss or filtering, it does not always mean a failure, as some routers are configured not to respond to traceroute probes.
By analyzing all these elements together, users can build a clear picture of how data is flowing through the network and where potential issues may exist.
Practical Uses in Troubleshooting Networks
Traceroute is widely used in real-world network troubleshooting because it provides actionable insights into connectivity problems. One of its most common applications is diagnosing slow internet connections. When users experience delays in accessing websites or services, traceroute helps determine whether the slowdown occurs within the local network, an external service provider, or closer to the destination server.
It is also useful for identifying packet loss issues. If certain hops consistently fail to respond or show irregular timing, this may indicate unstable network segments. These insights allow engineers to focus their investigation on specific parts of the infrastructure rather than guessing.
Another practical use is verifying routing behavior. In large networks, routing paths can change dynamically based on traffic conditions. Traceroute helps confirm whether data is taking expected routes or being redirected through unexpected paths. This is particularly important in enterprise environments where network performance and reliability are closely monitored.
Traceroute is also helpful when diagnosing firewall or security-related issues. If traffic is blocked at a certain point, traceroute results may show missing responses beyond a specific hop. This helps identify where filtering is occurring, even if the exact configuration is not visible.
In cloud and distributed systems, traceroute assists in evaluating latency between geographically separated systems. By analyzing hop-by-hop delays, administrators can better understand how physical distance and network infrastructure affect application performance.
Conclusion
Traceroute is a powerful and widely used diagnostic tool that provides deep visibility into how data travels across networks. By revealing each hop along a communication path, it allows users to understand not only where data is going, but also how efficiently it is reaching its destination. This makes it an essential utility for diagnosing connectivity issues, analyzing latency, and identifying routing problems.
Within environments such as Linux, traceroute plays a critical role in network management and troubleshooting. Its ability to break down complex network paths into readable, step-by-step information gives administrators and engineers a clear advantage when resolving performance issues.
Understanding how traceroute works—particularly its use of TTL values and hop-by-hop probing—helps users interpret results more accurately. While the tool has limitations, especially in modern secured and load-balanced networks, it remains one of the most reliable first steps in network diagnostics.
Ultimately, traceroute transforms invisible network behavior into understandable insights. Whether diagnosing slow connections or mapping routing paths, it provides clarity in environments where visibility is often limited, making it an indispensable part of any network troubleshooting toolkit. It also helps users build a deeper understanding of how modern networks operate in real-world conditions, including how data is routed, delayed, or filtered across multiple systems. By consistently analyzing traceroute results, administrators can improve performance tuning, strengthen reliability, and respond to issues more quickly and effectively.